Q1 National Real Estate Insights from the Germany + Sears Team at Compass, featuring an urban courtyard.

Q1 National Real Estate Insights

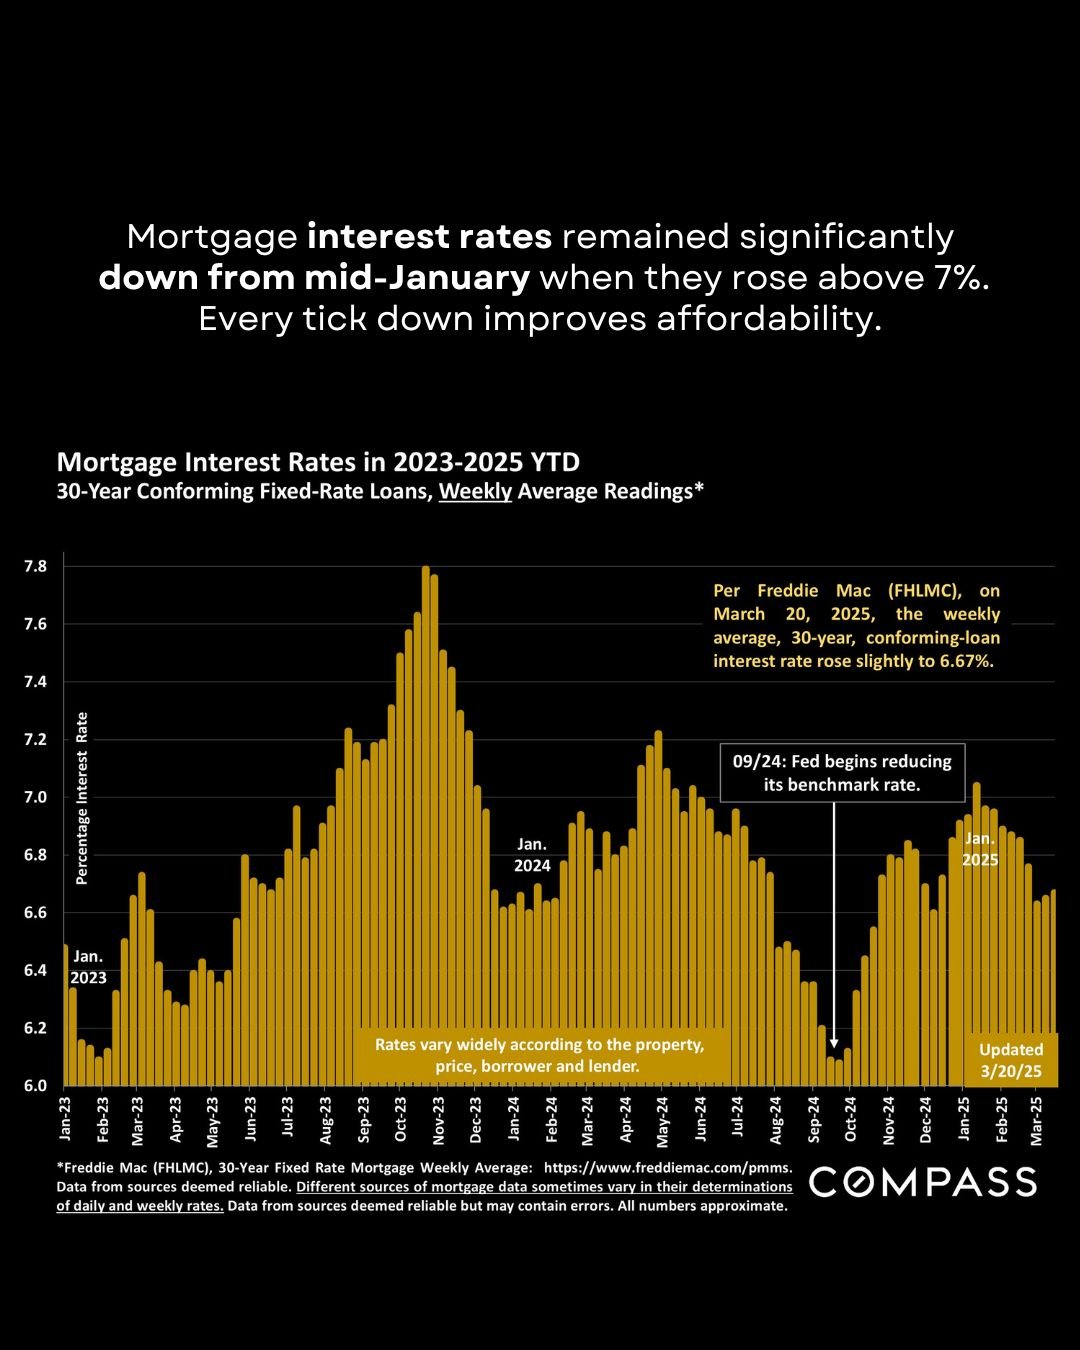
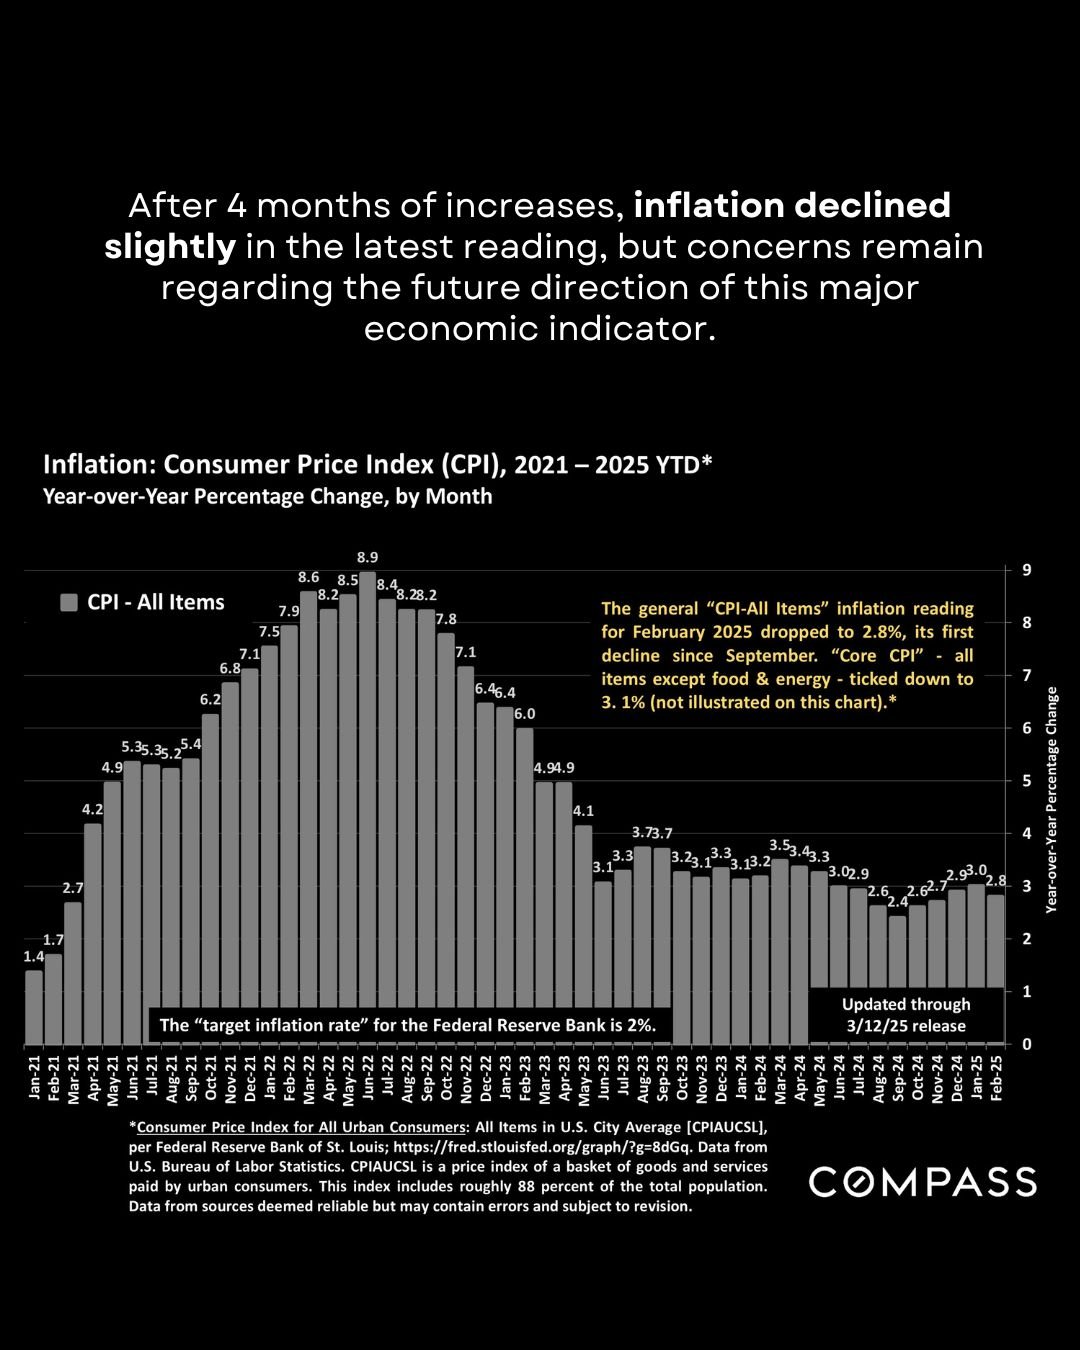
Inflation ticked down, the Fed again kept its benchmark rate unchanged, interest rates stayed well below 7%, and consumer confidence continued to fall across all population segments. Stock markets saw substantial declines, and then some recovery toward the end of the month. Generally, the broader market is more affected by interest rates and affordability, while the luxury market is influenced by the stock market and household wealth. 

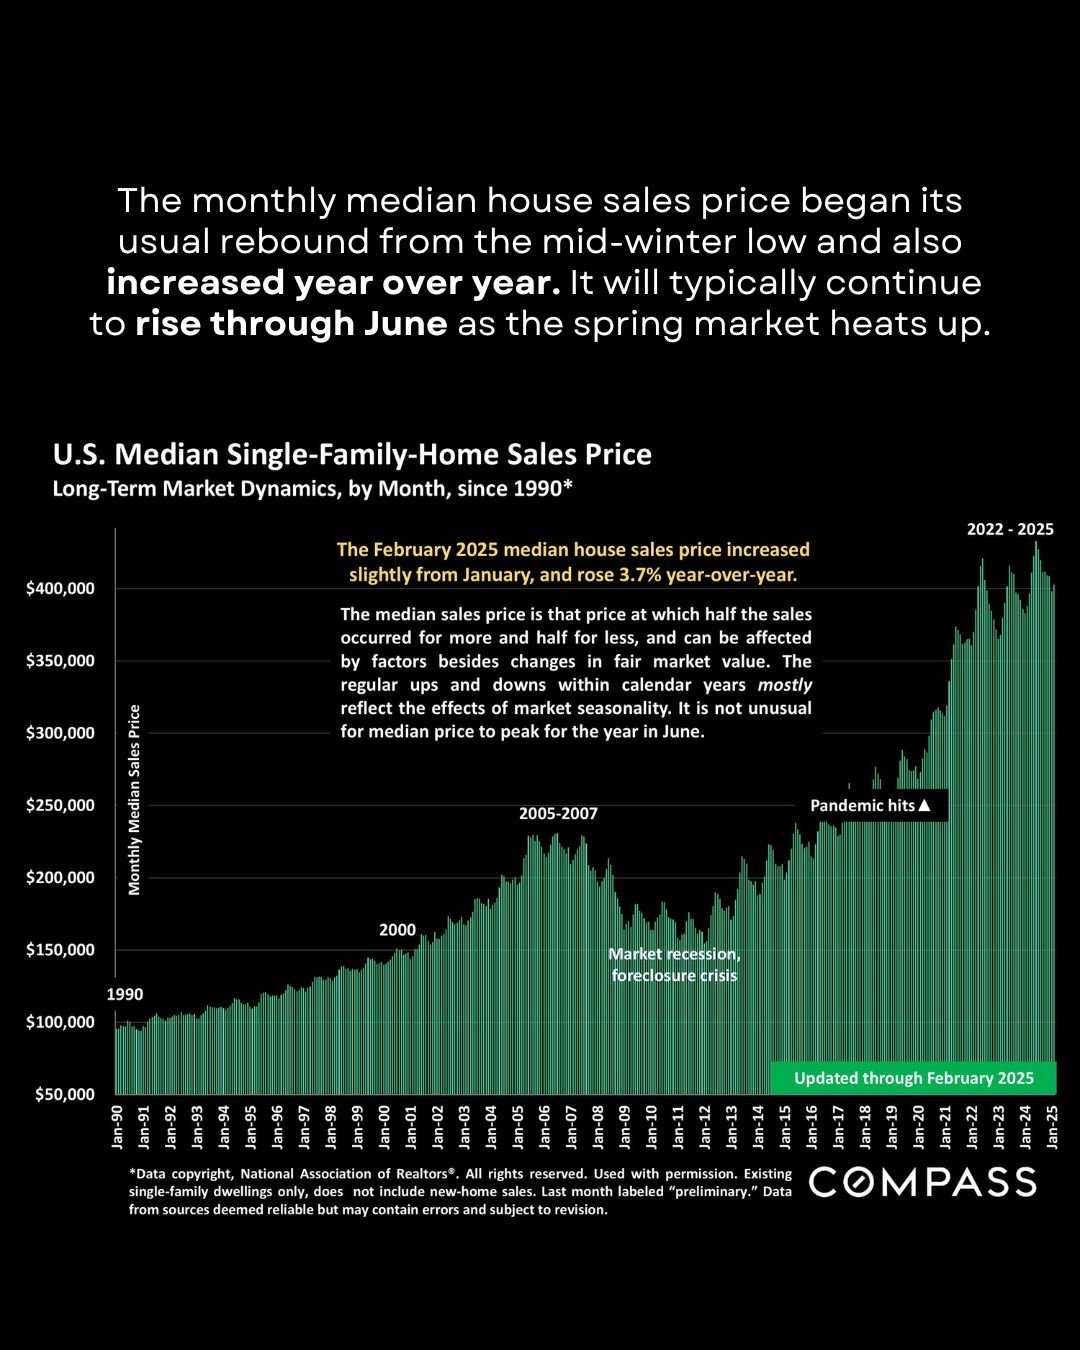
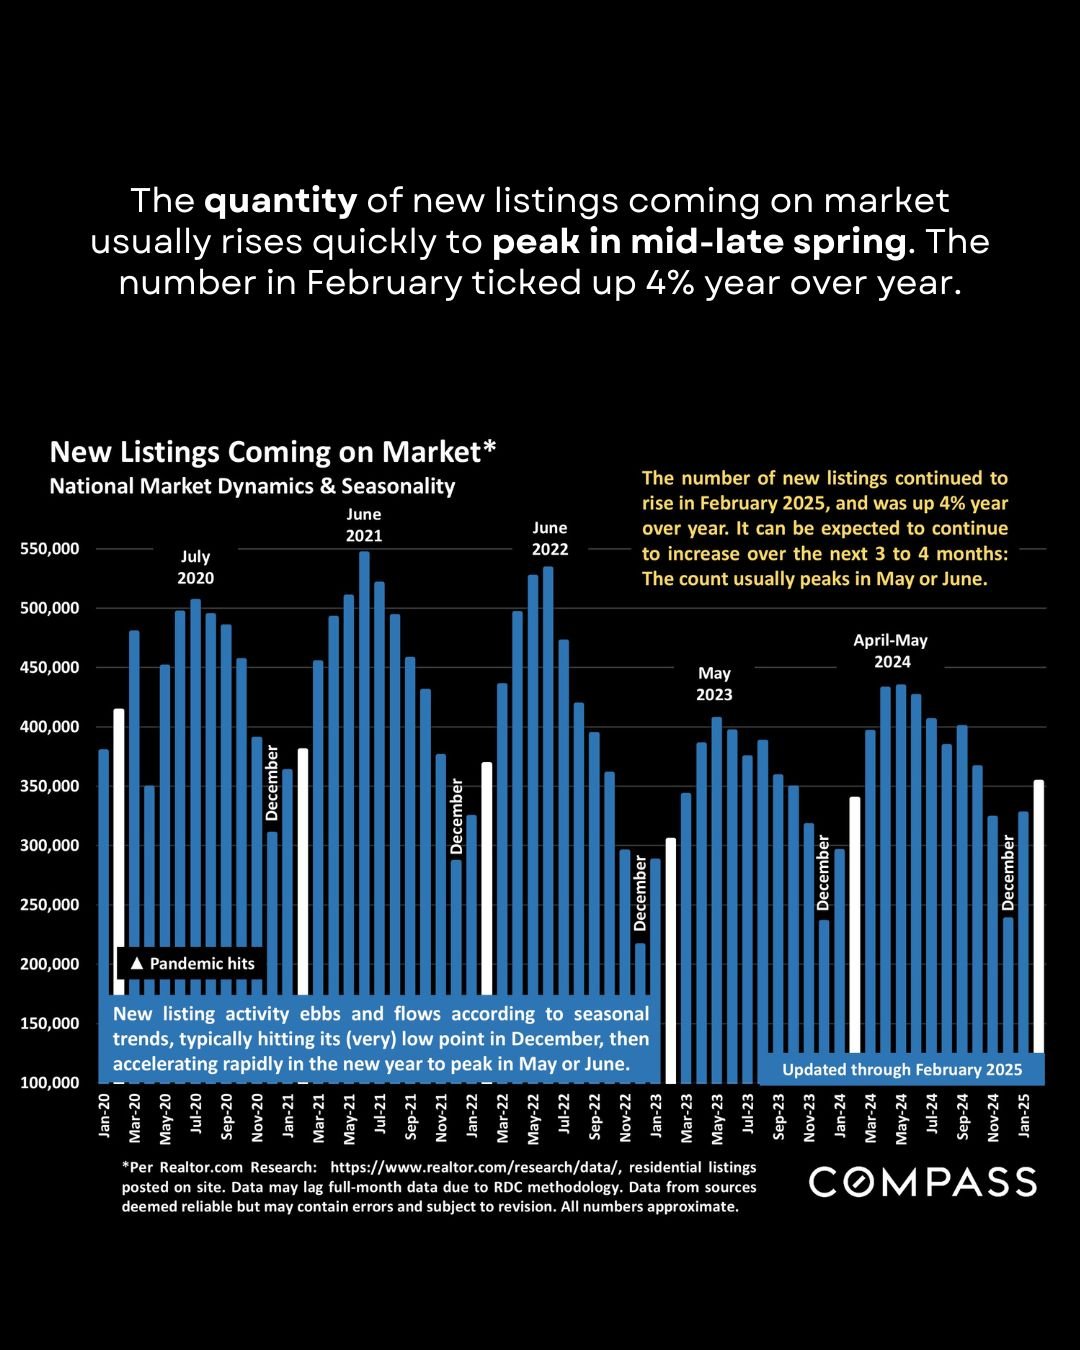
Year-over-year, monthly median home prices were up over 3%, 50% of homes sold in less than a month, and 21% closed for over asking price. All-cash sales rose to 32%, and first-time buyer sales rose to 31%. 24% of buyers waived their inspection and appraisal contingencies. The number of new listings rose 8% from January, and 4% YOY. It can be expected to climb through May or June. 

Much of February still reflects the late-winter market; March is typically when the spring selling season really begins!
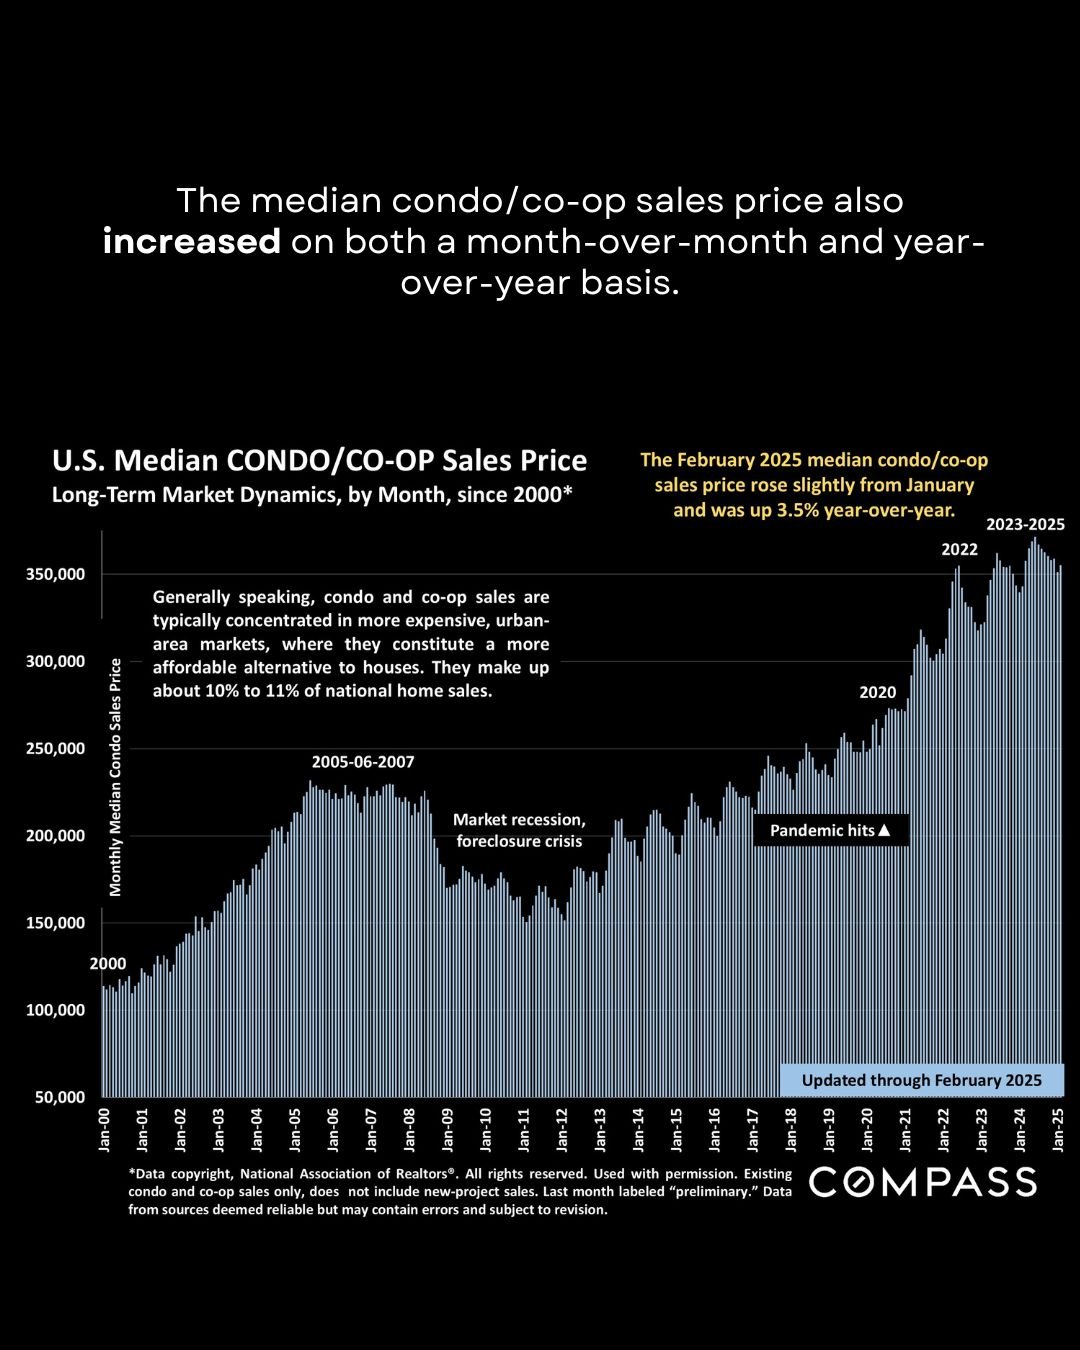
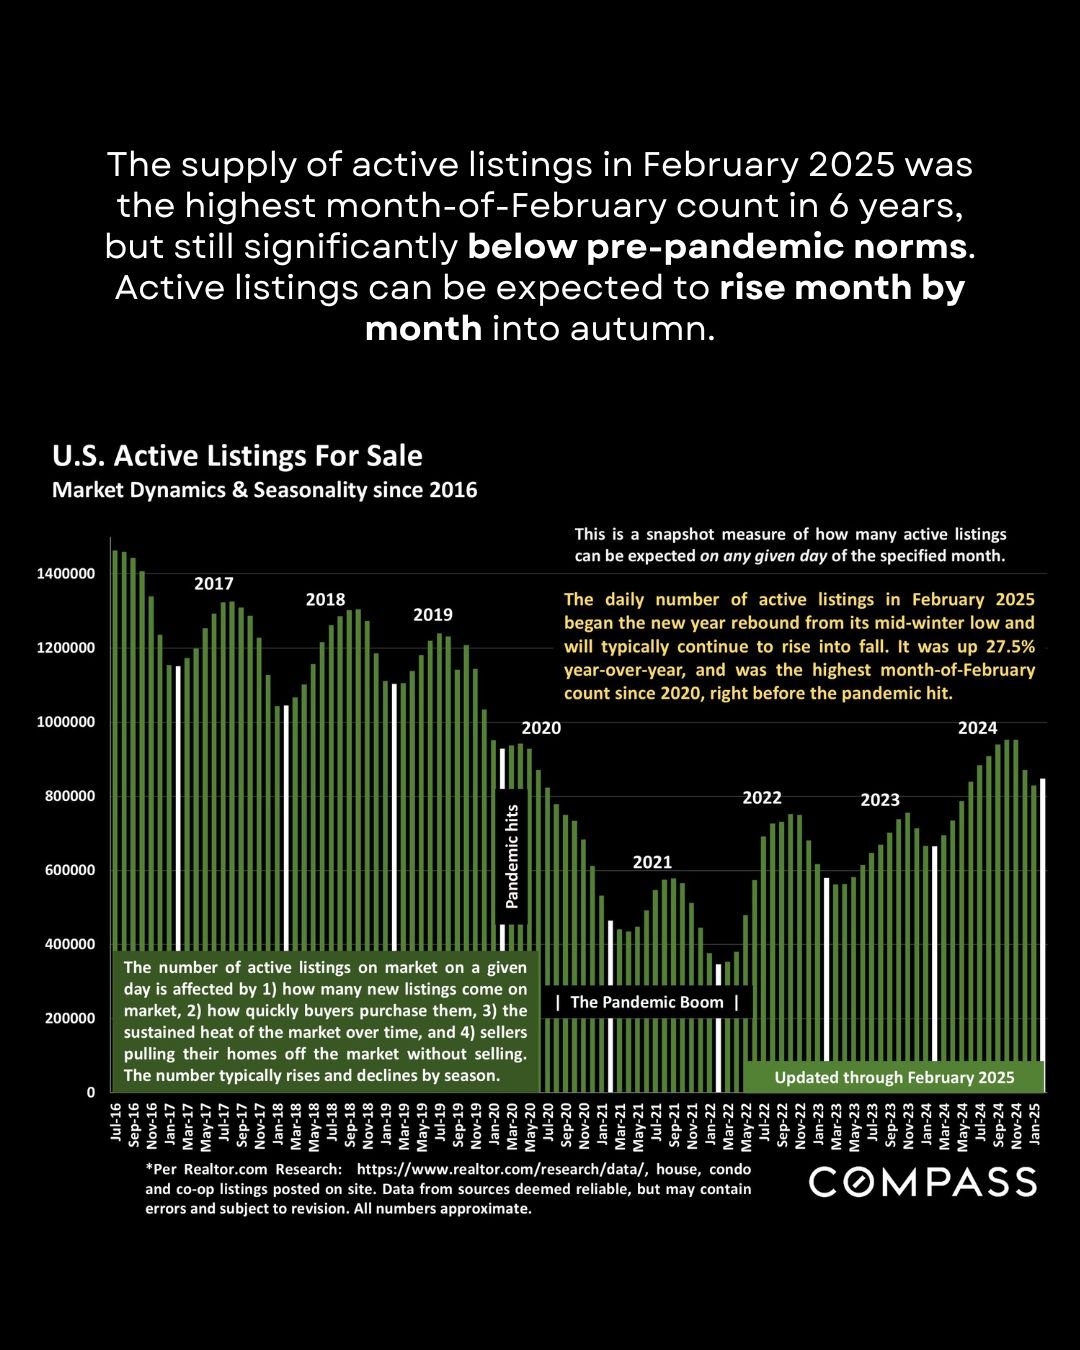
Chart of U.S. median condo and co-op prices, rising to about $350,000 by 2025, with recession and pandemic annotations.
Infographic charts U.S. active home listings from 2016 to January 2025, with a February 2025 market summary.
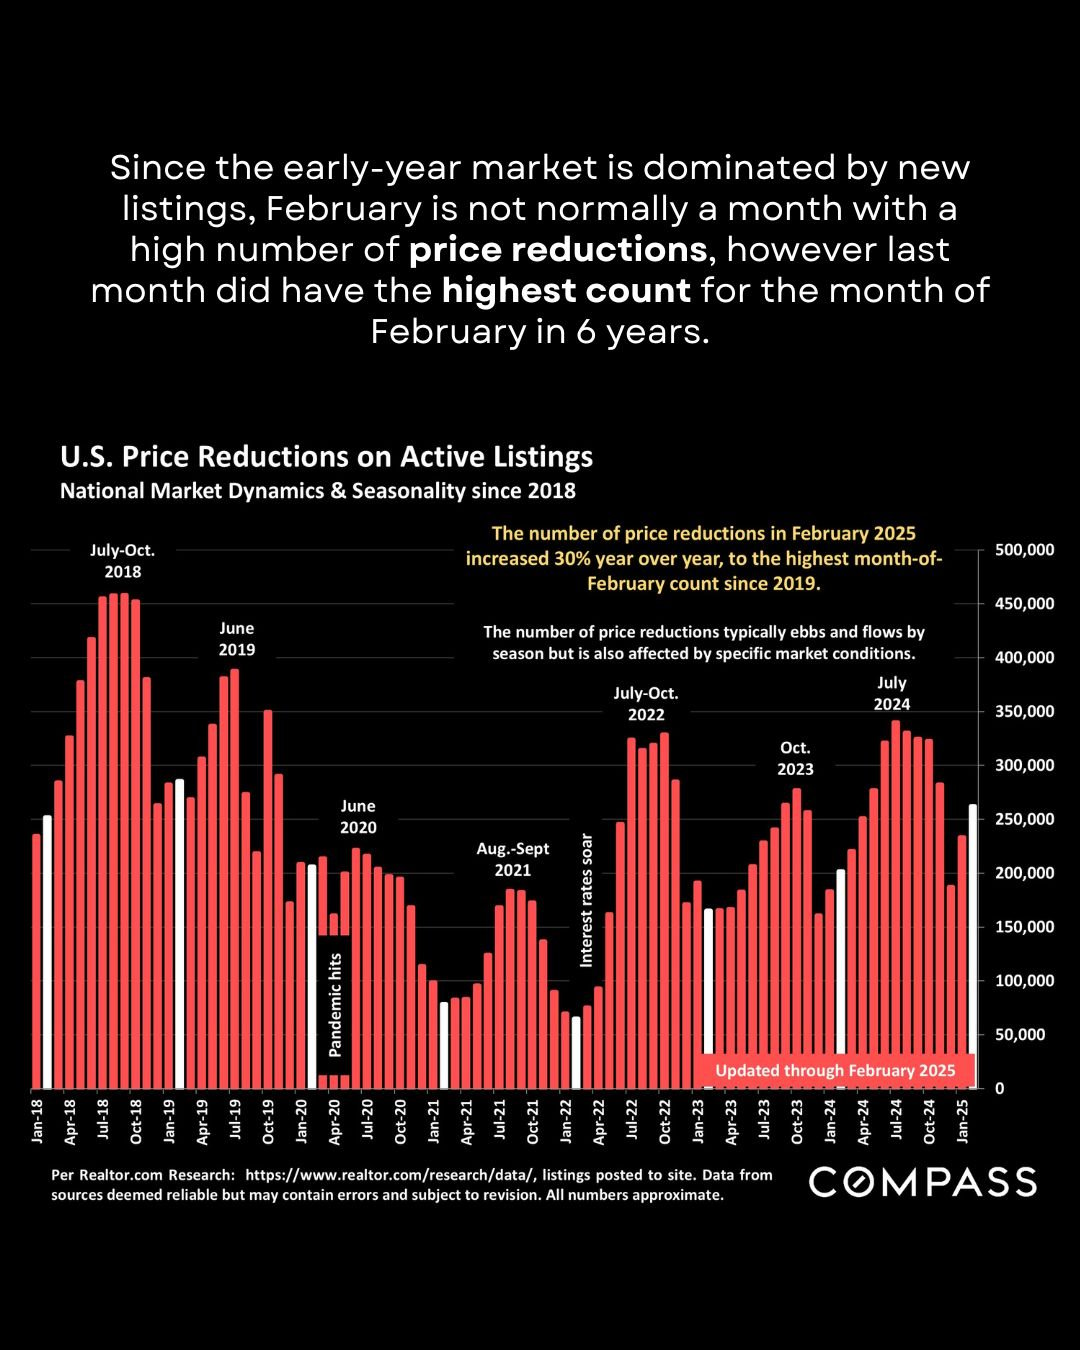
Infographic charts U.S. active-listing price reductions from 2018 to 2025, highlighting a 30% year-over-year rise in February 2025.
Mortgage-rate chart tracks weekly 30-year fixed loan averages from 2023 to March 2025, ending at 6.67%.
Chart compares Nasdaq and S&P 500 gains from January 2024 to March 2025, showing a sharp March decline.
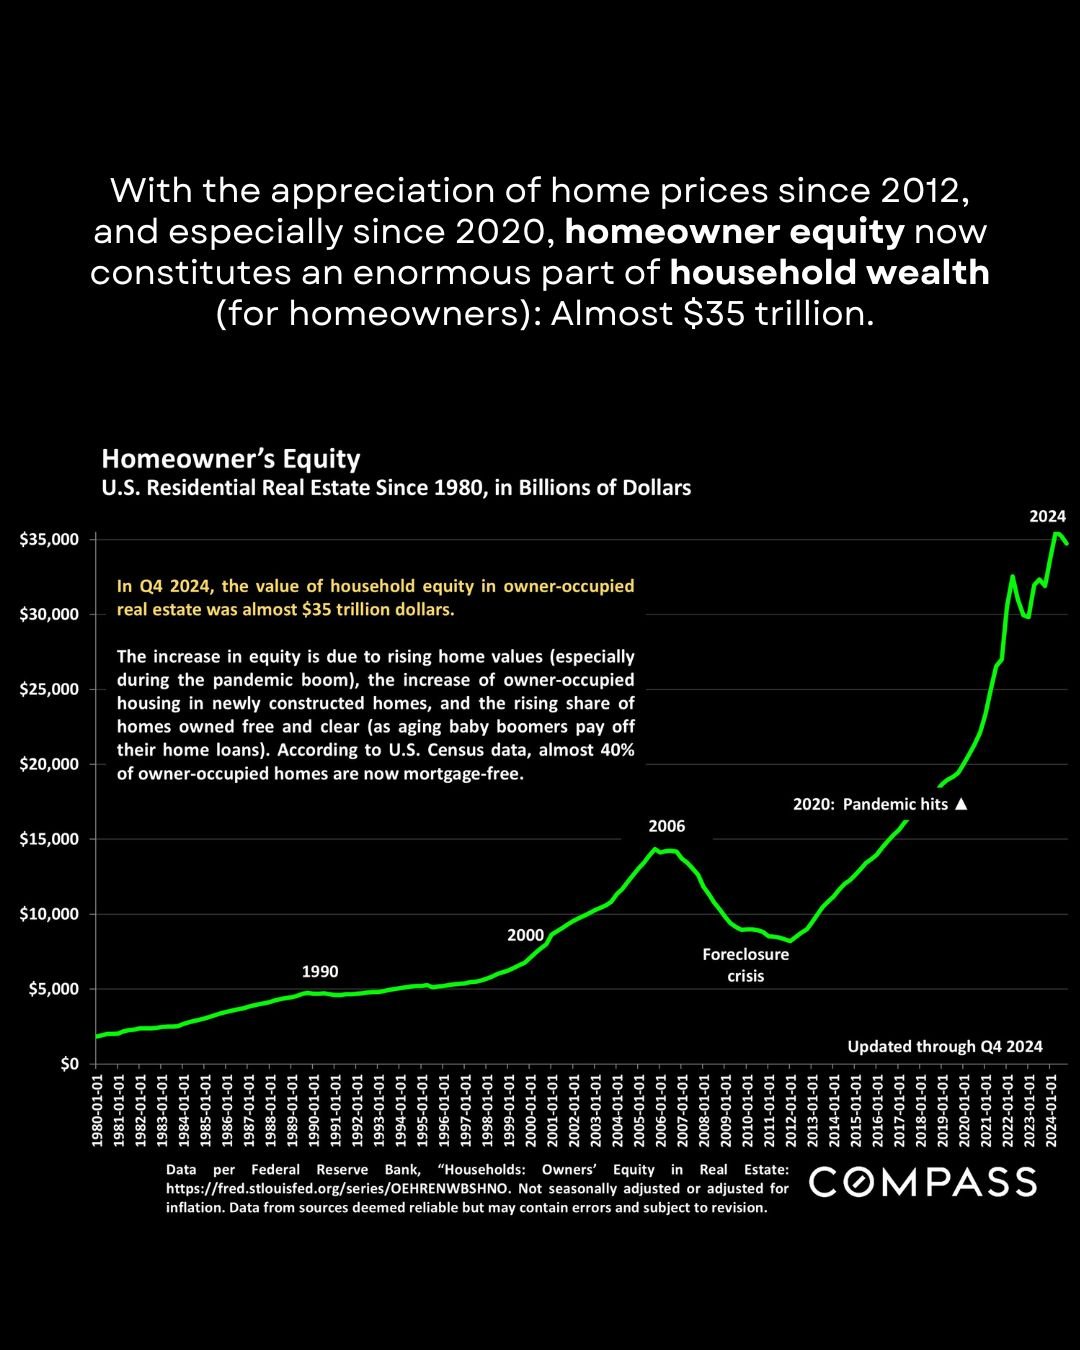
Infographic charts U.S. homeowner equity from 1980 to Q4 2024, rising to almost $35 trillion.
Chart of U.S. median single-family home sales prices from 1990 to 2025, with a 3.7% annual increase noted for February 2025.
U.S. CPI inflation chart, January 2021–February 2025, peaking at 8.9% in June 2022 and ending at 2.8%.
Infographic chart of U.S. new listings, showing February 2025 up 4% year over year and a typical spring peak.
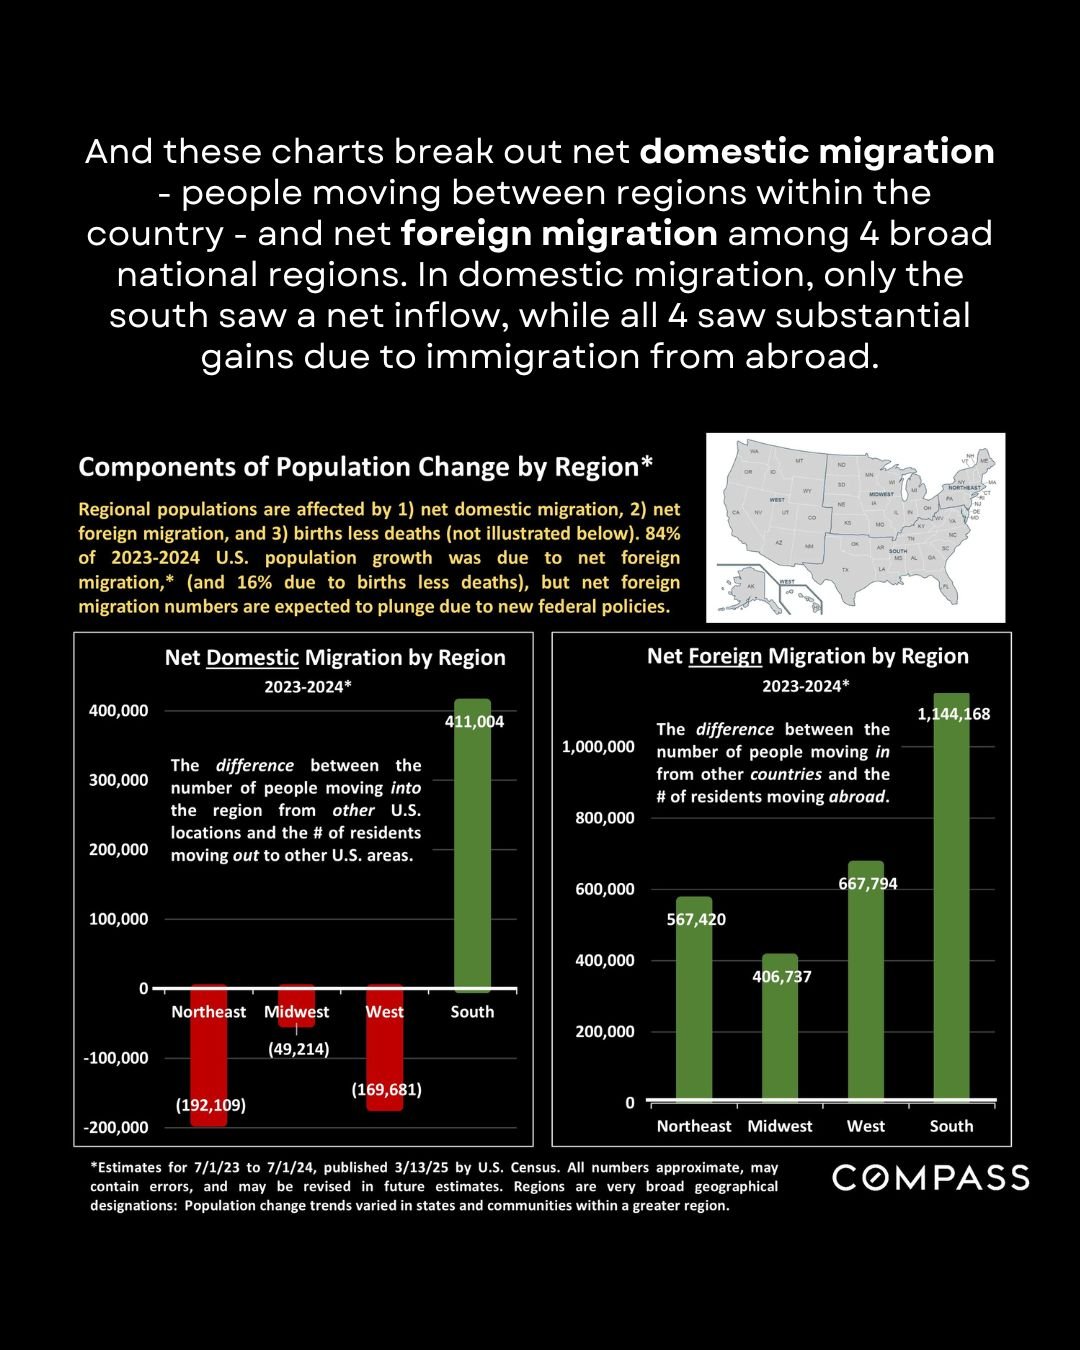
Infographic comparing 2023–2024 domestic and foreign migration across four U.S. regions, with a regional map and bar charts.
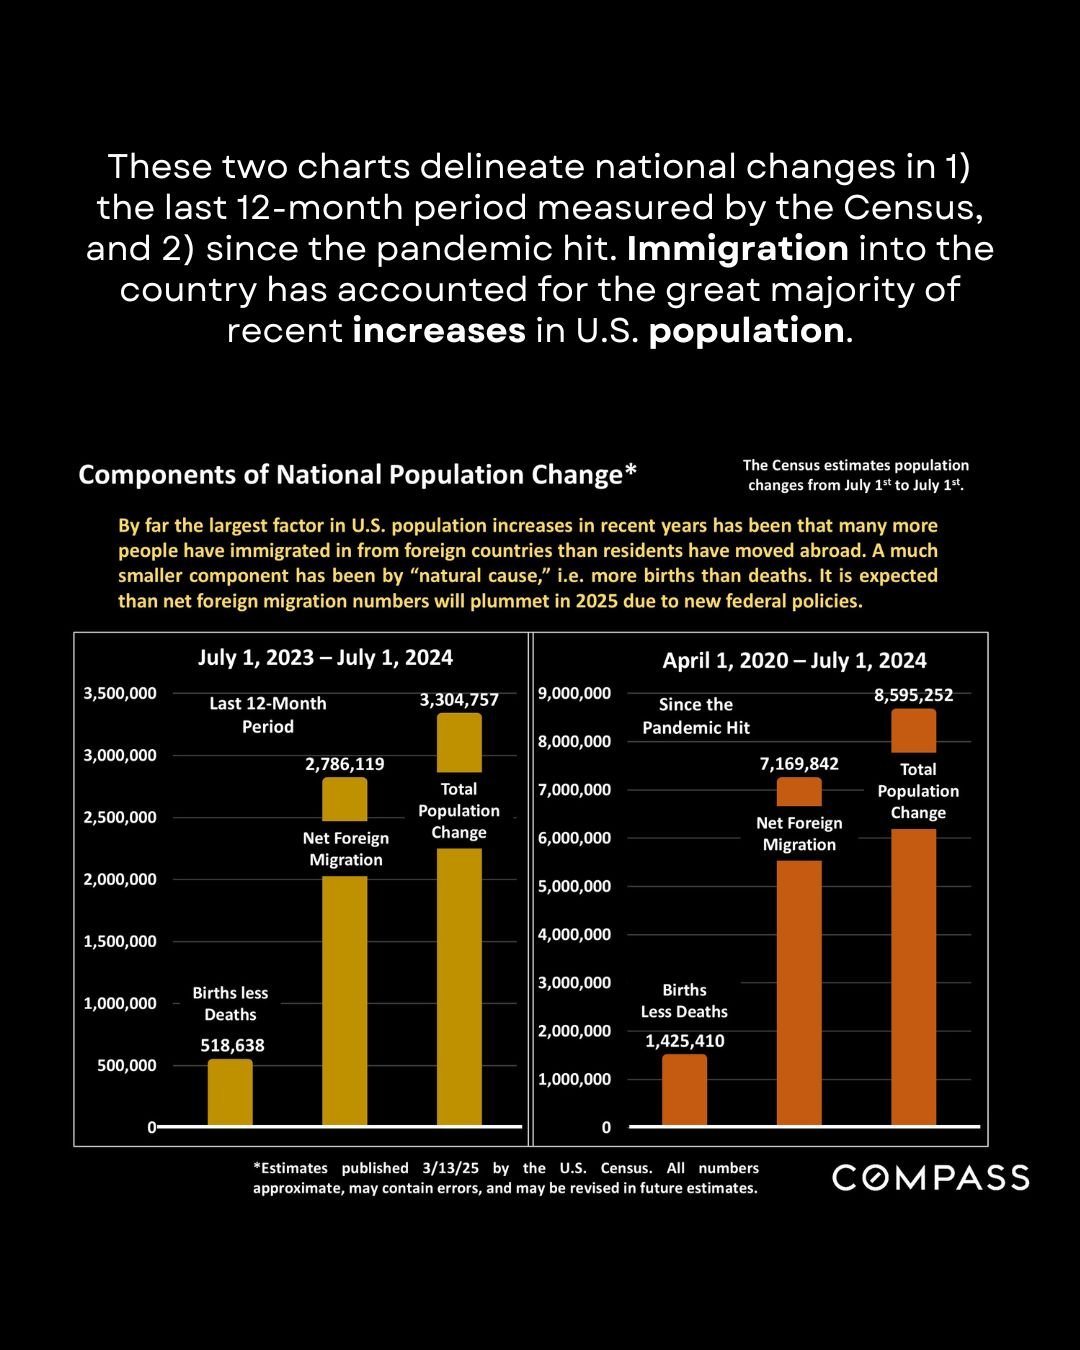
Infographic comparing U.S. population change over the past year and since the pandemic, with net migration and birth-death charts.
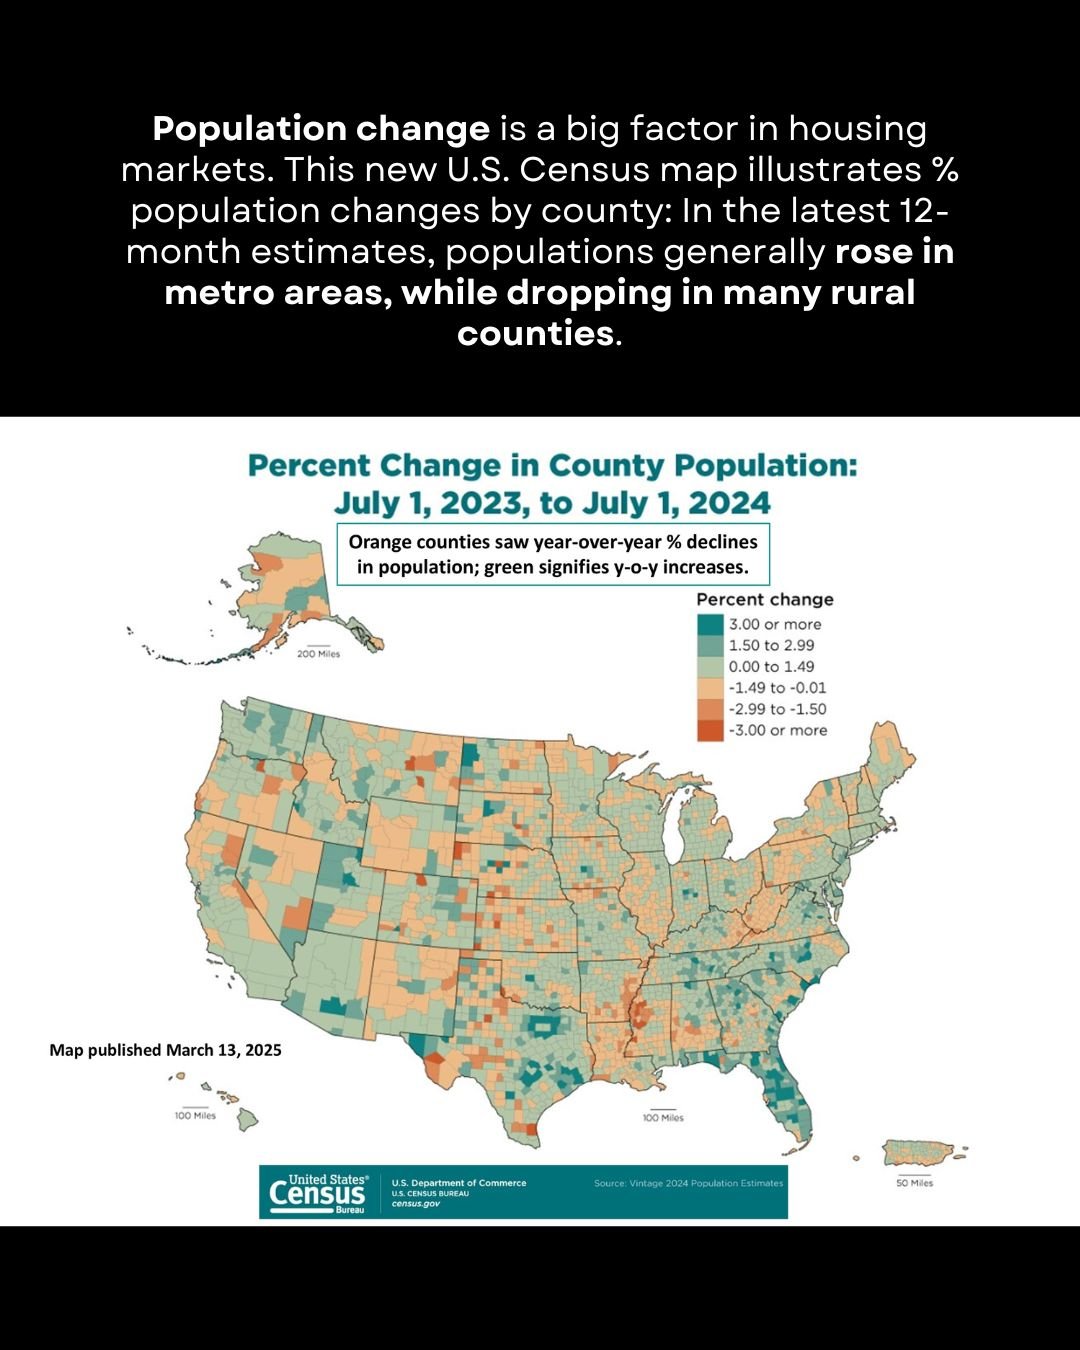
U.S. county population change map, July 2023 to July 2024, showing increases and declines.
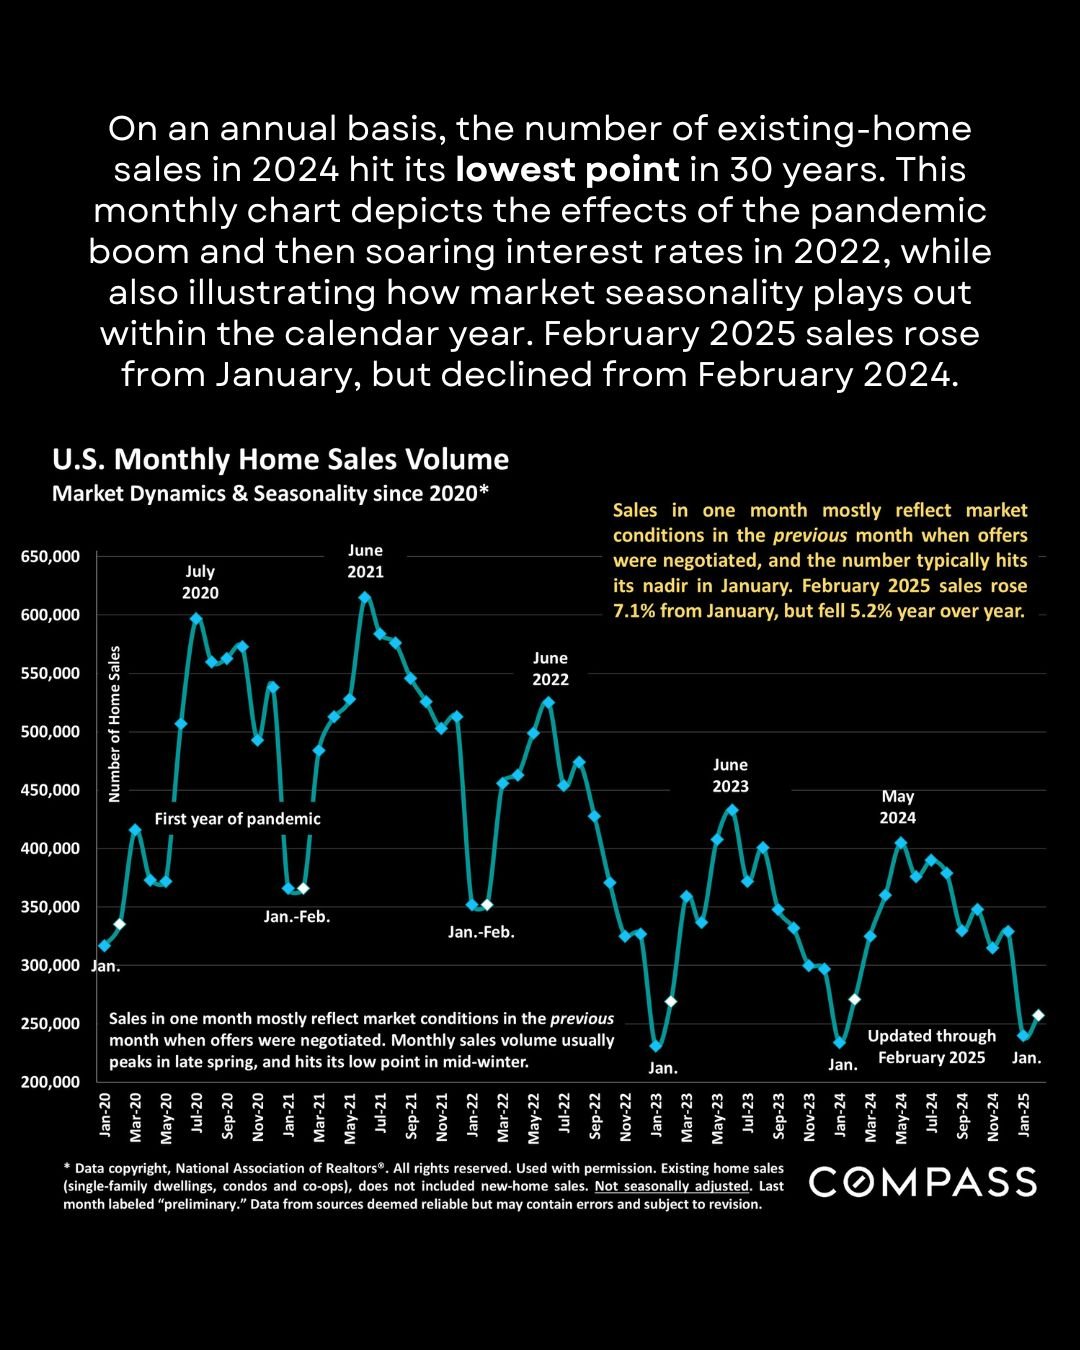
Infographic charting U.S. monthly home sales from 2020 to February 2025, with seasonal peaks and winter lows.

Work With Us

Our team’s unprecedented professionalism, skill, and attention to detail has allowed us to set sales records for the past years. Bringing together the passion, dedication, and resources to help our clients reach their buying and selling goals. With you every step of the way.

Follow Me on Instagram